|
Wall St. Sentiment Weekly 10/27/13
Institutional Sentiment & Analysis
Published Sunday 10/27/2013
By Mark Steward Young
Short-Term Sentiment: Bearish.
Overall Intermediate-Term Sentiment: Bearish for the market.
Individual Investor Sentiment: Bearish for the market.
Small Speculator Sentiment: ST Bearish for the market.
Small Hedge Fund/Manager Sentiment: ST Bearish and IT Bearish for the Market.
Longer-term Trend:
Bull Market Condition.
Intermediate-term Trend:
Positive.
Short-term (one-day) Signal:
2 Sells.
We are trading these signals and others intra-day for our Premium subscribers--contact us for details ( call at the number below or reply to this email).
********************************************************
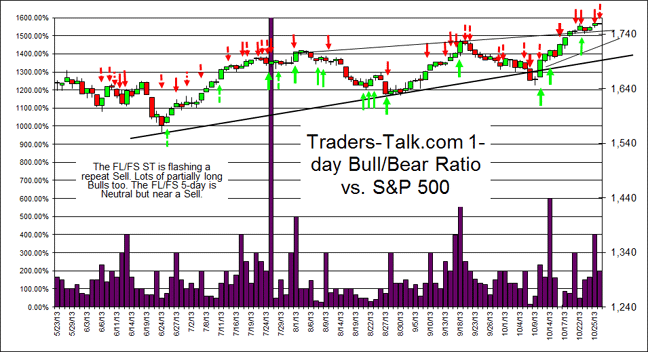
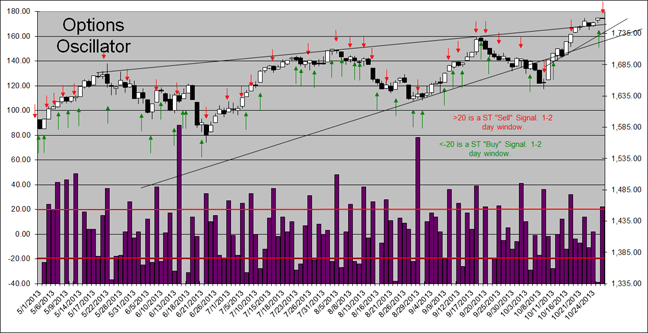
We have a repeat Sell from the FL/FS and a Sell from the Options Oscillator. The CBOE:SPX remains down though Momentum turned up marginally.
******************************************************** Results of the Wall Street Sentiment Survey (formerly known as the Fearless Forecaster Sentiment) taken after the close on 10/25/13:
Response was to this question: "At the end of next week will the S & P 500 close up (bull), down (bear), or unchanged/no opinion (neutral)?"
Weekly BULLS: 50%
Weekly BEARS: 40%
Our `Smart Money' Pollees were 0% Bullish and 75% Bearish.
Our Amateur Trader Pollees were 33% Bullish and 67% Bearish.
The Senticator is Neutral for the market.
The Weekly Sentiment Trading Model Shorted 1/2 SPY on Thursday at 174.92 and still holds this position. Past performance should not be considered a guarantee of future returns.
Last week, I was looking for modest sell off on Monday, and up Tuesday and Wednesday and down hard on Thursday, and up on Friday. The market was flat on Monday, Tuesday was up, Wednesday was down, and Thursday and Friday were up. We had the shape about right and offered useful strategy information. All in all, I think we have to take a C+ for that call. Note that these calls are for demonstration purposes. They are no substitute for a proper trading discipline.
Proprietary Surveys
This week, the WSS Surveyees are leaning Bullish, which implies more rally, at least in theory. The "Smart Money" Traders are rather Bearish and that implies weakness, but the "Amateurs" are Bearish too, and that may imply strength. I also note that our "Smart Money" guys occasionally cannot resist the urge to pick tops. I sometimes share that shortcoming, myself. I think that this is overall slightly Bearish for the market but it's top picking and thus tricky. The Senticator is Neutral and no help. We may re-evaluate this indicator for continued inclusion in our work. Note that this survey is from a virtually static pool of participants. The same traders and/types of traders have been participating for 15 years now with few additions or subtractions.
Message Board Sentiment:
The message board sentiment poll has Bulls at 42% and Bears at 32%. This is a little bit Bullish since this crew tends to be short-term right a bit more often than not. The Actual Position Poll shows 21% fully long and 37% partially long. 5% are partially short and 11% are fully short. This is well below our 20% threshold and is modestly Bearish for the market. The Fully Long/Fully Short is flashing a repeat Sell. The large number of partially long Bulls can often be expected to bring some weakness to shake 'em loose. We shall see. The 5-day is Neutral but near a Sell. Overall, I think this data is Bearish.

If you'd like to check out these poll results real time, the polls are pinned at the top of this page: http://www.traders-talk.com/mb2/index.php?showforum=2
Options Sentiment--
Daily P/C ratio: 0.93. Neutral.
10-day P/C ratio: 0.86. Neutral.
Equity P/C ratio: 0.64. Neutral.
OEX PC ratio (not a fade): 0.55. Bullish.
OEX 10-day PC ratio: 0.85. Heads up, this indicator may have inverted. This may be a Sell not a Buy.
ISEE Sentiment Index: 90 Buy.
10-Day ISEE Sentiment Index: 98. Buy.
Options Oscillator: 22. Sell.
Relative VIX: Neutral.
Daily VIX: Sell
CBOE:SPX: Sell.
OBSG: Buy.

The options are looking a little bit Mixed. We've got a Sell from the Options Oscillator but a buy from the OEX. We also still have a Sell from the CBOE:SPX and momentum. Tricky, but I think we can see some selling. The Market Harmonics' Options Buyers Sentiment Gauge (thank you, Tony Carrion http://www.market-harmonics.com) is coming off of BUY signal.

(If the chart is corrupted, use this link: http://www.market-harmonics.com/images/tec...nt/obsglong.gif
Most options indicators are contrary; if most folks are buying calls, we want to fade them and go short and vice versa. The OEX nominal P/C is an exception, because the OEX traders tend to be right, unless they are paying up for options (which will show up in the $-weighted data). The ISEE Sentiment Index indicator is contrarian; traditionally, over 200 is too optimistic, under 100 is too pessimistic. *$-weighted P/C data courtesy of Fari Hamzei of www.hamzeianalytics.com. Readings over 2.0 are Bullish and near 0.5 are Bearish. OBSG provided by Tony Carrion of Market Harmonics.
General Public Polls
TSP Talk came in with 58% Bulls and 34% Bears. I think this is still Bearish for the market. They had 58% Bulls and 30% Bears last week.
Citigroup Panic/Euphoria Model is still neutral. Not much help for this market.
http://online.barrons.com/media/marketSentiment.gif

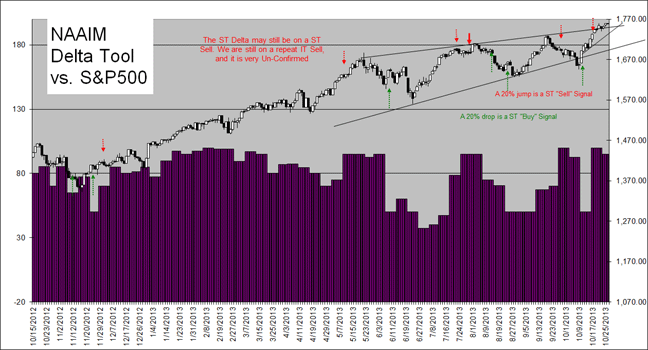
National Association of Active Investment Managers (NAAIM) Sentiment Survey reported that the Median market exposure fell modestly from 100.0% to 95%. This is still pretty over done. Last weeks big shift was a ST Sell that didn't deliver. I have to say, it might yet this week. The IT Sell is still in force and has been bolstered, but it is still unconfirmed. The mean exposure fell from 82.05% to 79.37%. That's not much of a move at all. The minimum exposure went from 5% LONG to 100% Short. The Maximum exposure jumped a bit from 130% to 150% long. It looks one or two advisors got much more Bearish, but most of the rest got a little more Bullish. I think that these readings should have garnered us some selling. They may yet. For more on this, see our white paper here, http://www.traders-talk.com/mb2/index.php?showtopic=116382 .

AAII is showing 49.20% Bulls and 17.57% Bears. Last week, we had 46.28% Bulls and 24.92% Bears. This is more Bulls, and a lot less Bears again. This is Bearish for the market, and think it's an outright Sell. That said, I also consider this sector of sentiment to be less relevant than in years past. It's has not been a fade for a while. I think it will be again, but let's not hang our hats on this.
Investors Intelligence reported 49.5% Bulls and 18.50% Bears vs. 42.3% Bulls and 21.60% Bears last week. That's a lot more Bulls and quite a few less Bears. This is a ST Sell. Note that this crew will probably have to be much more Bullish for longer in order to mark anything like an important top.
The Newsletter Advisors got more Bullish at 66.00% (Long) vs. 49.20% (Long). This is showing an awful lot of Bullishness. The Naz advisors got even more Bullish, too at 87.50% long vs. 75.00% long last week. Way too Bullish to be comfortable with, but so far, they're right. This may be enough to generate some more weakness.
Lazlo Birinyi's site, Tickersense reported 56.52% Bulls and 30.43% Bears vs. 49.15% Bulls and 22.22% Bears the prior week. That's many more Bulls and more Bears too than last week. This is still Bearish for the market but interesting. Good news that there are more Bears. This is our least predictive survey. Or rather, it was.
Conclusion
Last week, I said that I would not be surprised by some profit taking because of increased emotionality. Also, we had a solid Fully Long/Fully Short Sell, and a big time Sell from NAAIM. I noted that the market was strong, however and the trend was inarguably up. I suspected that we might get a false start down that is bought, then later in the week we might see more of a sell off. That's pretty much exactly what we saw, but honestly, I'm thinking we can expect to see more selling. I'm not sure how much more, of course. The trend is still quite strong, and so is breadth. Momentum turned back up (but did not confirm). That said, we're very overbought. That can easy persist, but we've also got a set up for some selling. I'm also looking at the CBOE:SPX as an early warning and it has been persistently negative for a bit now. We additionally have a FL/FS Sell and an Options Oscillator Sell. Those usually pay off when in tandem. Sure, it's top picking, and thus risky. If you're an IT trader, I'd not do anything, except perhaps let a few poorly performing positions go. But speculators, it looks better now for a top than it has in a bit. My call for the week is for a sell off on Monday, and Tuesday, up Wednesday, down on Thursday, and up on Friday.
NOTE: We are now adding an addition part to Wall St. Sentiment Weekly; an Investor's Letter, which will be primarily for Investors who just want very simple and straightforward guidance. Feel free to share it with your friends who need a little help investing.
NEW Breadth Model:
We exited the Long 1/2 SPY at 168.89. (we held it from 168.64). The Breadth Model is flashing a low quality Buy. We are going to wait for a pullback, for better or worse.
A word on our new Breadth Model: This trading model is based upon breadth momentum and has a seasonal and sentiment overlay to trim risk a bit. Signals are designed to capture much more of the "swing moves". We've watched these indicators for 20 years and we've got some confidence in their utility. We'll use the S&P ETF's for tracking purposes.
Weekly Trading Model: We have switched to a more robust sentiment approach with a momentum and trend overlay. Momentum is now Negative and Sentiment for this model is Bearish. The model Shorted 1/2 SPY on Thursday at 174.92. Only a half because the trend is up and strong. We hold over the weekend.
For our Premium Service, day traders are looking both ways. If you'd like a trial, feel free to contact us (service@wallstreetsentiment.com).
****************
Ideal ETF Portfolio (tracking portfolio):
25% SPY at 119.51
25% SPY at 144.15
50% Money Market.
The trend is Neutral. Breadth is Negative. We may decrease exposure. Watch for an alert.
*******************************************************
The above "Ideal ETF Portfolio" Model does not represent an actual managed account nor a managed account program that we offer. This is only for tracking purposes for the KTT and Premium newsletters. Past performance is no guarantee of future returns. All information included in this missive is derived from sources we believe to be reliable, but no guarantee can be made to that effect. None of the forgoing should be construed as an offer or solicitation to buy or sell any security. The publisher may have a long or short position in the funds or securities discussed at any given time. We aren't your advisor, unless you have a signed contract with us. Please review any trade that you do with your trusted advisor FIRST.
---------------------------------------------------------------------------------
Note that we are publishing on our private area on Traders-talk.com, providing on-line access to our charts and research. The password is at the top of this letter.
http://www.traders-talk.com/mb2/index.php?showforum=47
(you'll need to register and sign in on Traders-talk and you'll need an additional password to access the board. If you are a subscriber and you do not have a password, please contact us).
For more on using Wall Street Sentiment and the various sentiment data included, click here:
http://www.WallStreetSentiment.com
Mark Young
Editor
859-393-3335
818-MARKETS
Order today by calling 859-393-3335 or order on-line at WallStreetSentiment.com

|